We currently observe some incompatibilities with Safari browser.
We're working on fixing them, but on the meantime we advise you to use some other navigator like Firefox or Chrome.
Mix & Pick
Reducing biases in group assignment
With small sample sizes and numerous covariates, basic randomisation schemes do not adequately control assignment bias.
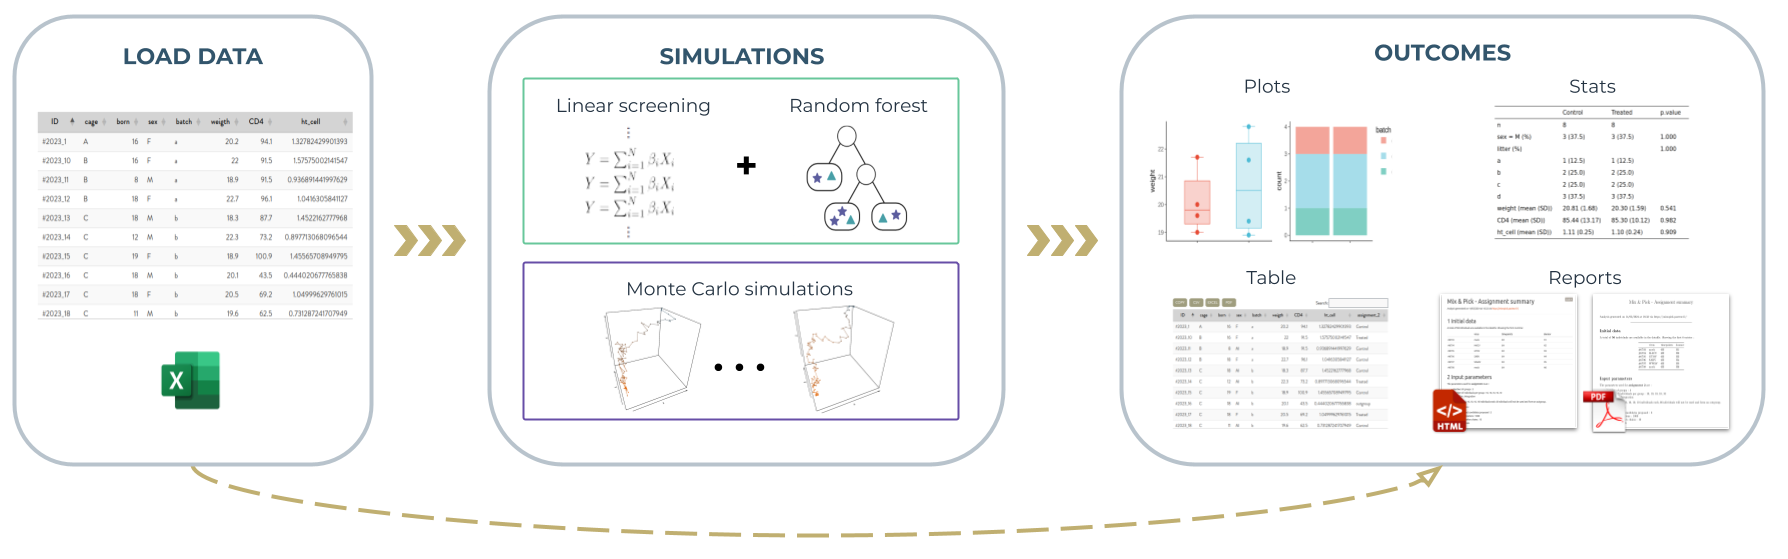
Generate balanced groups: Starting from a user-provided dataset, Mix&Pick performs conditional randomisation. Our tool assigns individuals to user-defined groups (in number and size) with minimal bias while accounting for quantitative and qualitative covariates. Several candidate allocations can be generated together with visualizations and statistical quality control. Final group assignments can be exported along with a summary report to ensure reproducibility.
Assess group balance: The application also provides a way to assess the balance of user-provided assignments, that were obtained using other methods.
Latest news
30/11/2023
New version available
Mix & Pick version 1.0 is released, improving user experience & navigation.
22/05/2023
Mix & Pick is online !
Shiny application integrating Mix&Pick algorithm and visualisations is available online.
22/01/2023
Mix & Pick algorithm
Implementing two methods to generate homogeneous randomized groups, taking into account a set of quantitative and/or qualitative covariables.
Team






Loading your data
Step 1: Load your data table
- Select an identifier (ID) column, if available. Ensure that this ID column uniquely identifies each row in the dataset. If no identifier is provided, the application will use the row numbers of the data table, by default.
- Drag each covariate into the appropriate box to identify its type : quantitative (e.g. weight, height) or qualitative (e.g. sex, batch, strain)
- Drag covariates you want to discard from further analysis into the box "unused variables". They will be merged back at the end, but not involved in the randomisation process
- At the bottom of this page, check wether the choices of covariates & their types is correct and wether any issues were detected. Once this is done, validate to continue to the next step.
Running simulations
Step 2: Define your experimental design and parameters
- Specify the number of groups, their sizes and names,
- Select an assignment method.
- Optional : adjust advanced parameters according to the selected method.
- Once the design is finalized, you can launch the simulations.
Define your expected design
Enter group sizes & names. Add as many groups as you need with the buttons.
Group sizes
Group names
Add/remove groups
 Best overall performances
Deals best with small groups & small groups sizes
Slower execution
-
Fastest execution, ideal when dealing with high number of variables and/or individuals.
-
Gold standard method, usually used in clinical trials.
Critical variable
Advanced parameters
One last check before running ...
Computations might take some time, depending on the size of your dataset. If you get disconnected, please refresh and try again with a lower number of simulations (see advanced parameters).
Outcome
Step 3: Evaluate and export an assignment. This final step provides visualizations and statistical summaries to help assess balance in the assignment:
- Review bar plots for qualitative covariates and box plots for quantitative covariates.
- Statistical tests are performed to assess group effects on covariates, individually.
- Select a final assignment from the proposed candidates. The corresponding assignment table can be exported as a CSV file.
- Generate a report summarizing the different stages of the analysis in HTML or PDF format.
Visualisation of the results
Show outgroup category ?
Select an assignment :
Assignment evaluation :
To evaluate the quality of randomisation, we compare the variance within the created groups to the total variance, across all variables. Doing so we estimate an overall percentage of variance imputed to selection bias: the lower the better ! This percentage represents the amount of unwanted effect that will be transfered into your biological comparisons, so its impact will also depend on the magnitude of effects you wish to detect. A good assignment will have a lower percentage, no significant effects of covariates and no noticeable patterns in the plots, so make sure to check all evaluations before making your choice !
Plots :
Desc. Table :
Here is applied a One-way ANOVA test for quantitative variables and a Fisher's exact test for qualitatives variables.
If some pvalues appear in red, you should select another canditate. If no candidate seems suitable, go back to simulation step and try to launch with the other assignment method and/or change some advanced parameters (eg. increase number of simulations).
Export your results
You can export the table below to a .csv, .xls or .pdf file. It contains your initial data table with an additional column for the chosen group assignement.
Proposed order :
Randomisation does not stop at group assignment: biases can also occur when processing individuals sequentially. To help you prevent those, we added a "proposed order" column for you tu use along with the selected group assignment. Whether you need to fill-in wells off a plate or take individuals out for a specific test, following the given order will ensure you do so in a randomised way.
Download report
You can also save a report summarizing all the chosen parameters, technical info and results to ensure reproducibility.
Loading your data
The first step consists to load the datatable :
- Drag your variables according to their type : quantitative (eg. weight, height) or qualitative (eg. gender, cage, strain)
- Select an ID column, if you have one. Make sure that your ID column uniquely identifies each row in the datatable. If no identifier is specified, the application will take the datatable row numbers by default.
- Once the data has been checked and approved, validate to move on to the next stage.
Outcome
This last step provides several visualisations and statistics to check that your groups are well-balanced
Visualisation of the results
Show outgroup category ?
Assignment evaluation :
To evaluate the quality of randomisation, we compare the variance within the created groups to the total variance, across all variables. Doing so we estimate an overall percentage of variance imputed to selection bias: the lower the better ! This percentage represents the amount of unwanted effect that will be transfered into your biological comparisons, so its impact will also depend on the magnitude of effects you wish to detect. A good assignment will have a lower percentage, no significant effects of covariates and no noticeable patterns in the plots, so make sure to check all evaluations !
Plots :
Desc. Table :
Here is applied a One-way ANOVA test for quantitative variables and a Fisher's exact test for qualitatives variables.
If some pvalues appear in red, your groups are not perfectly balanced. You should probably re-generate them if you have the possibility.
Mix & Pick team
Mix & Pick is an application developed by members of the Hub of Bioinformatics and Biostatistics of the Institut Pasteur.
Find more information about the Hub on the team webpage Click here to contact the Mix&Pick authors by email.
Authors
Check out our other applications
We developped other Shiny apps to help you with experimental design. Do not hesitate to have a look !
SHADE : Power analysis & reporting tool
Perform power analysis & draft report for animal experimentation (CETEA)

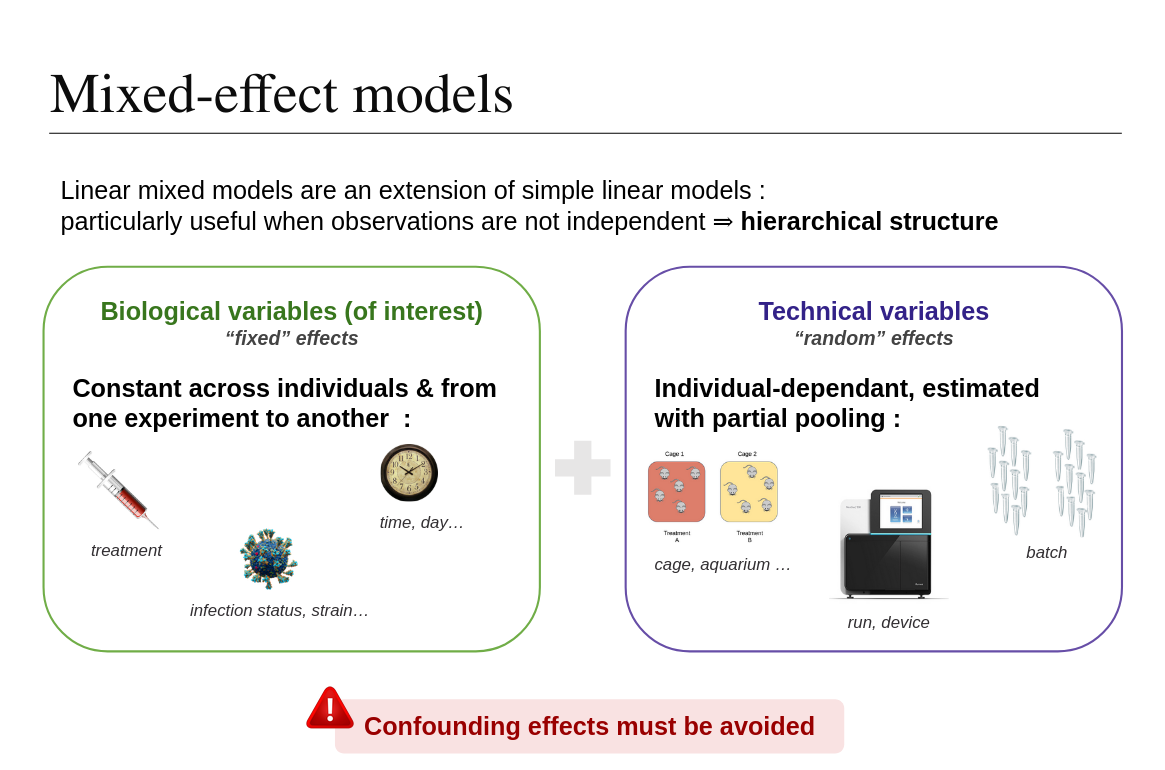
User-friendly Mixed Models analysis
Perform statistical analysis with structured data